THE SHORT ANSWER
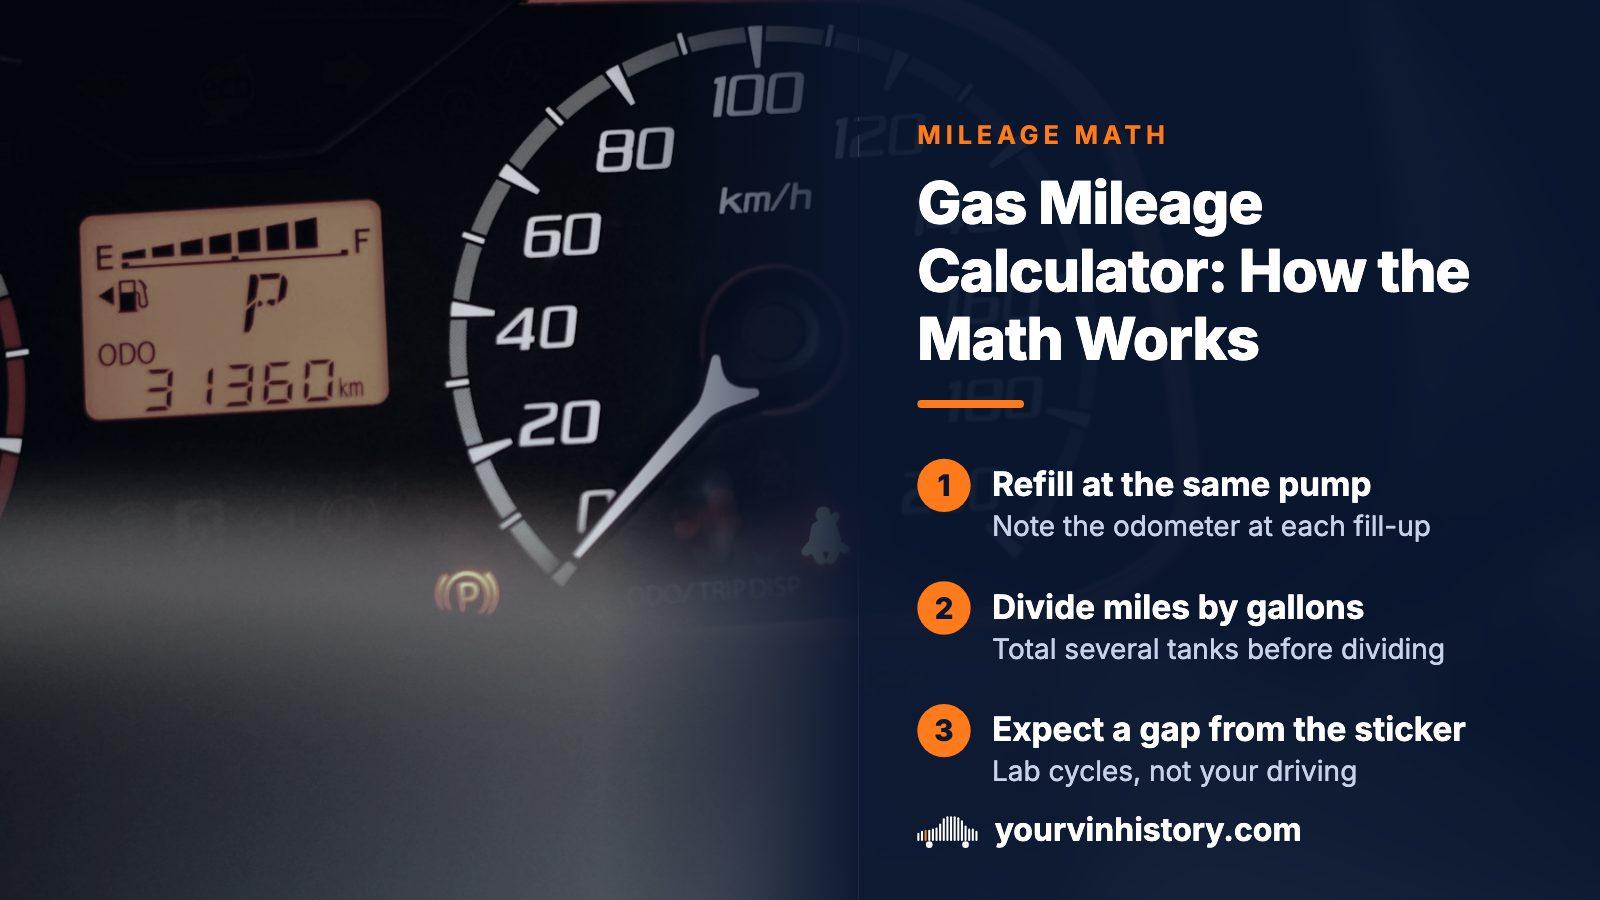
To calculate gas mileage, note the odometer at a fill-up, drive, refill at the same pump, then divide the miles by the gallons added. Repeat across several tanks, totaling the miles and the gallons before you divide. The window sticker will differ because it comes from laboratory cycles, and its combined figure is a harmonic average that gives city a weight of 0.55 and highway 0.45.
- Basic formula
- Miles traveled over gallons put in at the pump
- Combined rating
- Harmonic blend: city 0.55, highway 0.45
- City test cycle
- 21.2 mph average, 23 stops in 11 miles
- Results EPA re-tests
- About 15%–20%; manufacturers run the rest
The one division behind every gas mileage calculator
Every gas mileage calculator, from a phone app to a spreadsheet template, runs the same operation: miles traveled divided by gallons of fuel consumed. The result is miles per gallon, or mpg. There is no hidden second step and no special formula for trucks. Tools differ only in how carefully the inputs were gathered.
That is why this site has no calculator box. Dividing one number by another needs no tool. What deserves explanation is the quality of the inputs, the gap between your result and the sticker, and the unusual average behind the sticker figure. One worked example follows.
Where the two inputs should come from
A calculator is only as good as the two numbers it is handed. A fuel tank fills to a shut-off level, not to a metered volume, so the fuel burned over a stretch of driving is known only if you fill to the same point at both ends. The gallons on the second receipt are your consumption. The trip computer shows an estimate worked out from engine data rather than a measurement at the nozzle.
- Gallons: the amount on the receipt for the second fill, topped off to the same shut-off point as the first
- Miles: the odometer difference between those two fills, covering a whole tank or more
- Weak inputs: a trip computer readout, a single errand, or a tank that began only partly full
Sample length matters too. One cold start or one jam on the interstate can move a single trip by several mpg, so a short sample describes the drive rather than the car.
Why equal mpg gains are not equal savings
Miles per gallon puts the thing you pay for, fuel, in the denominator. Nobody drives a fixed number of gallons. People drive a fixed number of miles, and the fuel varies. Gallons per mile is therefore the figure that adds up cleanly, and mpg bunches together as it climbs. Here are some ratings turned over into fuel burned per 100 miles.
| Rating (mpg) | Fuel per 100 miles (gallons) |
|---|---|
| 15 | 6.67 |
| 20 | 5.00 |
| 25 | 4.00 |
| 30 | 3.33 |
| 40 | 2.50 |
| 50 | 2.00 |
Climbing from 15 to 20 mpg trims 1.7 gallons from every 100 miles. Climbing from 40 to 50, a bigger jump on paper, trims only 0.5. Over 12,000 miles a year, a pickup that improves from 15 to 18 mpg saves 133 gallons, while a compact that improves from 30 to 40 saves 100. The smaller gain on the thirstier vehicle wins. When comparing two candidates, convert both to gallons per 100 miles before the mpg figures sway you.
A worked example: 20 city and 35 highway
The combined figure on a window sticker is not the plain average of the city and highway ratings. Section 600.210-12 of Title 40 of the Code of Federal Regulations requires a harmonic average of the unrounded results, with city weighted 0.55 and highway weighted 0.45, then rounded to a whole number. Consider a car whose city rating is 20 mpg and whose highway rating is 35.
| Method | Result |
|---|---|
| Plain average, same weights | 26.8 mpg, rounded to 27 |
| Harmonic average, same weights | 24.8 mpg, rounded to 25 |
| Gap between the two | 2 mpg, and the rule requires the lower one |
- Convert each rating to fuel per mile. At 20 mpg, the city leg burns 5.00 gallons per 100 miles.
- Multiply the city fuel figure by 0.55 and the highway fuel figure by 0.45.
- Add the two products to get the blended fuel use per mile.
- Invert that total to return to miles per gallon, then round to the nearest whole number.
The plain average runs higher whenever the two ratings differ, because the weights describe shares of miles, not shares of gallons. Miles at the lower rating burn more fuel, so they drag the true blend down further. The same trap catches anyone who averages the mpg of two tanks or two household cars.
What the five laboratory cycles actually measure
The ratings behind the combined figure come from standardized procedures on a dynamometer, a set of rollers that lets a car drive in place. The EPA publishes the attributes of all five.
| Cycle | Average speed | Distance | Stops | Conditions |
|---|---|---|---|---|
| City (FTP) | 21.2 mph | 11 miles | 23 | A/C off, cold start, 68–86 °F |
| Highway (HWFET) | 48.3 mph | 10.3 miles | None | A/C off, warm start, 68–86 °F |
| High speed (US06) | 48.4 mph | 8 miles | 4 | A/C off, warm start, 68–86 °F |
| Air conditioning (SC03) | 21.2 mph | 3.6 miles | 5 | A/C on, warm start, 95 °F |
| Cold temperature | 21.2 mph | 11 miles | 23 | A/C off, cold start, 20 °F |
The city cycle lasts 31.2 minutes with the engine idling 18% of the time. The highway cycle tops out at 60 mph and never stops. The last two cycles exist because a hot afternoon and a January morning look nothing like the baseline. The result is a yardstick for comparing vehicles under identical conditions, not a forecast of one driver's week.
Who actually runs the sticker test
Many buyers assume a federal lab tested their exact model. The EPA says otherwise. Carmakers run the tests on vehicles they build, usually pre-production prototypes, and send the numbers in. Agency staff review them and repeat roughly 15%–20% of the tests themselves, in the agency's own National Vehicles and Fuel Emissions Laboratory. The remainder stands as the maker reported it.
That changes how to read the number. A sticker figure is a standardized, partly verified report on a prototype, measured at controlled temperature on rollers. The EPA also lists small manufacturing variations between vehicles of one make and model, so any single car can land a little off.
Why your tank usually reads lower, with EPA percentages
The EPA's consumer site puts numbers on several everyday factors that pull real-world economy away from the rating.
| Factor | Effect the EPA reports |
|---|---|
| Aggressive driving | 15%–30% lower at highway speeds, 10%–40% lower in stop-and-go traffic |
| Air conditioning | About 5%–25% lower on the Max setting than with it off |
| Gasoline with 10% ethanol | 3%–4% lower |
| Reformulated or oxygenated fuel | 1%–3% lower |
| Winter versus summer gasoline | Typical summer gasoline carries about 1.7% more energy than typical winter gasoline |
| A new engine | 3–5 thousand miles before economy settles |
No percentage, no guess
The EPA also lists factors it leaves unquantified: idling, hills, unpaved roads, towing, roof racks and extra cargo, four-wheel drive engagement, brake drag, poor tire inflation or alignment, and cold weather with frequent short trips. All of them cost fuel. With no published figure, none is quoted here.
Matching your car to the right rating
Much of the disappointment about mpg is really confusion over which vehicle is being measured. The EPA's Find a Car tool starts from model year, make and model rather than a VIN, and one nameplate in one year can carry several ratings split by engine, transmission and drive type. Those rows are not interchangeable.
The VIN settles which row is yours. NHTSA's public decoder reports manufacturer-supplied build data for a number, and these are the details to pull out:
- Engine and displacement: the usual reason one model carries more than one rating
- Transmission type, since manual and automatic versions get their own ratings
- Drive layout: front-wheel, rear-wheel or all-wheel
- Fuel type, including flex-fuel versions that can carry a second rating
A vehicle history report also lists factory specifications for the exact VIN, which helps when a listing leaves the engine or drivetrain unstated.
Measuring your own mileage across several tanks
A usable measurement takes about four tanks and one habit: repeat everything the same way each time.
- Fill until the nozzle clicks off the first time, then write down the odometer reading.
- Drive normally for the whole tank. A figure produced by unusually gentle driving describes a person who does not exist.
- Refill at the same station, ideally the same pump, and stop at the first click again. Nozzles differ in how readily they shut off, and that difference lands directly in your gallons figure.
- Subtract the first odometer reading from the new one and divide by the gallons on the receipt.
- Repeat for three or four tanks. Add all the miles together, add all the gallons together, and divide once.
- Compare the result with the rating that matches your engine, transmission and drive type, not the headline entry.
When falling mileage is a symptom, not a habit
A healthy car still falls short of its sticker, so the absolute shortfall tells you little. The change is what deserves attention. A car that held steady for two years and now returns noticeably less is reporting something. A car that has always run below its rating mostly reflects the commute.
- An abrupt decline while your route and the season are unchanged, which can point to a faulty sensor
- A decline alongside a lit check-engine lamp, where the stored fault code narrows the search
- A gradual slide across years, usually traced to worn or misaligned tires, dragging brakes and postponed maintenance
- A deficit present from your first tank in a used car, which several tanks of your own measuring can separate from the previous owner's habits
On a used car, every mileage-based comparison rests on an honest odometer. If readings across the title history do not climb in order, any fuel or wear estimate built on them is suspect. A vehicle history report that lists odometer readings by date lets you check that before you trust the seller's figure.
Where this information comes from
- EPA fueleconomy.gov: detailed test information — Source for each cycle's speed, distance, stops, idling share and lab temperature.
- EPA fueleconomy.gov: how vehicles are tested — Confirms that manufacturers test their own prototypes and that the EPA re-tests a share of them.
- EPA fueleconomy.gov: factors affecting fuel economy — Gives the percentage effects for driving style, air conditioning and fuel blends, and lists factors left unquantified.
- eCFR: 40 CFR 600.210-12, label value calculations — The federal rule that sets the harmonic average and the 0.55 city and 0.45 highway weights.
- NHTSA: vPIC VIN decoder — Public decoder that returns manufacturer-reported build data for a VIN.
Sources and photos: Facts checked against the sources above in October 2026. Photo by muhammad dennisa on Unsplash; diagrams by YourVINHistory.
Keep reading
- Engine size by VINEngine details are the usual reason a single model has several different ratings.
- Fuel type by VINFuel grade and flex-fuel capability change what each mile costs.
- OBD2 codesReading the code behind a sudden drop in economy.
- Odometer rollback checkA mileage figure you cannot trust undermines every calculation here.
Frequently asked questions
How do you calculate gas mileage?
Top off the tank and write down the odometer. After driving, top it off again at the same pump and divide the distance by the fuel added. If you log many fills, total every mile and every gallon first, since averaging the separate mpg results overstates the answer.
Why is my gas mileage lower than the EPA estimate?
The rating comes from laboratory cycles run at 68–86 °F, and the city cycle averages just 21.2 mph. Real driving adds hills, cold starts, cargo and speed. The EPA puts aggressive driving alone at 15%–30% at highway speeds, and small manufacturing variations mean two cars of one model can differ.
How is combined MPG calculated?
The EPA blends the city and highway results with a harmonic average, weighting city 0.55 and highway 0.45, then rounds to the nearest whole mpg. A car at 20 city and 35 highway comes out at 25 combined. A plain average would give 27, which is why calculators that use one overstate the figure.
Does air conditioning really lower gas mileage?
Yes. The EPA says running the A/C on its Max setting can cut mpg by about 5%–25% compared with leaving it off. One of the five test cycles, SC03, is run at 95 °F with the compressor on, which is how the agency tests that extra load.
Is there a way to find a car's mpg rating using its VIN?
Not directly. The EPA's Find a Car tool starts from year, make and model. The VIN tells you which engine, transmission and drive type your car was built with, so you can pick the matching rating instead of a similar-looking one. Check those details first when a model was sold with several powertrains.
Now check the car itself
The guide explains what to look for. The report shows what this VIN has on record.