THE SHORT ANSWER
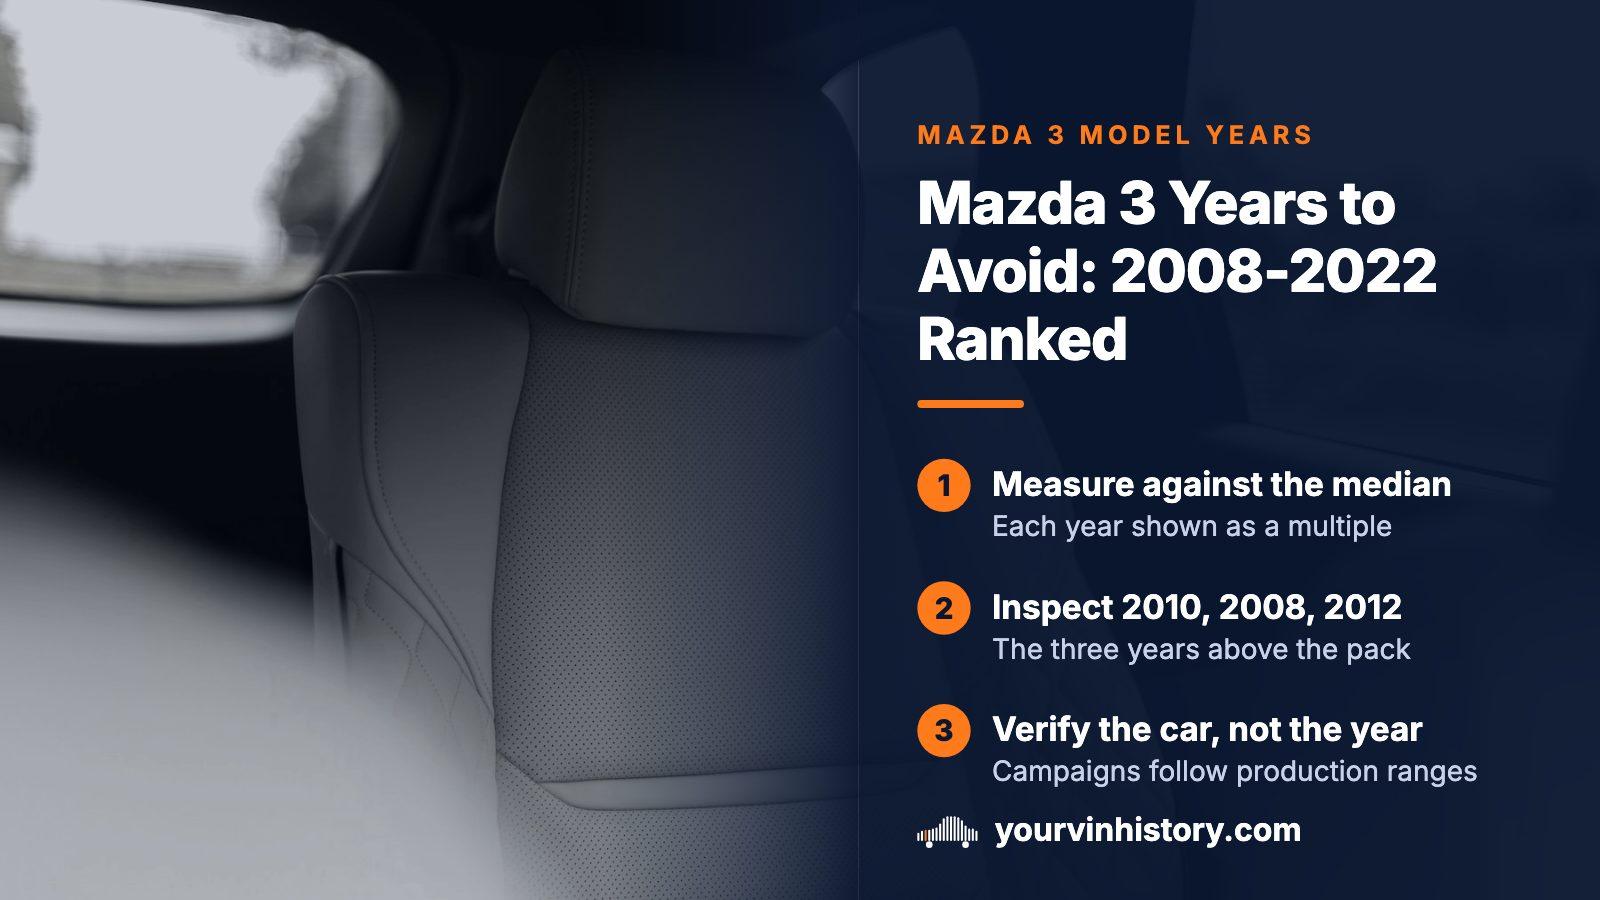
Of the 15 model years, 2010 draws the most NHTSA complaints at 686, which is 5.86 times the Mazda 3's own median of 117. The 2008 year (303) and the 2012 year (226) come next. Every year outside those three lands near the median or below it. Complaint counts are unverified owner reports, not failure rates, so a high year is a reason to inspect harder.
- Complaints on record
- 2,321 across 2008 to 2022
- Median year
- 117 complaints
- Peak year
- 2010, with 686 complaints
- Top complaint bucket
- Unknown or other, 301 reports
How each year is measured
Sales volume bends every raw complaint count. A popular model year piles up reports even when the cars are fine, and a scarce one can look spotless for the opposite reason. So this ranking does not set the Mazda 3 against other cars. It takes the median of the model's yearly totals, 117 complaints, and states each model year as a multiple of that figure.
The pool is every NHTSA owner complaint filed for the 2008 through 2022 model years, 2,321 in all, with duplicates removed using the agency's own complaint number. The data was pulled on 2026-08-16, so anything filed later is missing. Recall counts for each year sit beside the complaints because they record something different, which a later section covers.
All fifteen model years, heaviest first
The standing column is a plain-word reading of the multiple. Outlier, high and elevated mark years worth a closer look, typical means close to the median, and light means well beneath it.
| Model year | Standing | Times the median | Complaints | Recalls |
|---|---|---|---|---|
| 2010 | Outlier | 5.86× | 686 | 3 |
| 2008 | High | 2.59× | 303 | 3 |
| 2012 | Elevated | 1.93× | 226 | 1 |
| 2014 | Typical | 1.18× | 138 | 4 |
| 2011 | Typical | 1.13× | 132 | 2 |
| 2015 | Typical | 1.1× | 129 | 4 |
| 2009 | Typical | 1.02× | 119 | 4 |
| 2013 | Typical | 1× | 117 | 1 |
| 2018 | Typical | 0.91× | 107 | 4 |
| 2016 | Typical | 0.87× | 102 | 6 |
| 2017 | Typical | 0.71× | 83 | 2 |
| 2019 | Typical | 0.63× | 74 | 6 |
| 2021 | Light | 0.42× | 49 | 1 |
| 2020 | Light | 0.27× | 32 | 2 |
| 2022 | Light | 0.21× | 24 | 0 |
| Median (2013) | Benchmark | 1× | 117 | n/a |
The 2013 cars sit exactly on the median line. Read the whole table as a map of where owners chose to file reports, not as a verdict on any single car.
Reading the 2010 spike
Complaints climb from 119 for 2009 to 686 for 2010, then fall straight back to 132 for 2011. The shape deserves attention. A step this large can mark a redesign or a major mechanical change, and a lasting change would be expected to leave later years elevated too. Instead 2011 returns to the median band, so whatever drove the 2010 total did not carry forward in the counts. The complaint data cannot say what that cause was.
For the 2010 year, structure is the area owners reported most, with unknown or other also prominent, and NHTSA lists 3 recalls against it. This site has a separate record page for the 2010 Mazda 3 that names its open recall campaigns and splits the 686 reports by component.
The three years that deserve a harder look
Three model years sit clearly above the benchmark. A high multiple is a reason to inspect and bargain, not a reason to assume any one car is defective, because every year has sound examples.
- 2010: 686 complaints, 5.86 times the median, with structure the most reported area
- 2008: 303 complaints, 2.59 times the median, led by steering reports
- 2012: 226 complaints, 1.93 times the median, led by power train reports
Recalls do not line up neatly with those counts. The 2008 and 2010 years each list 3 recalls, while 2012 lists only 1 despite its elevated complaint total. That mismatch is a reason to read the recall column and the complaint column together, never one alone.
The quiet end of the table, and its catch
By count, 2022 (24 complaints, 0.21 times the median, no recalls), 2020 (32, 0.27 times, 2 recalls) and 2021 (49, 0.42 times, 1 recall) carry the lightest records. They are also the three youngest model years, and a car that has been on the road briefly has had little opportunity to collect filings. Part of that low count is simply age.
A more informative band is 2016 through 2019, which reads at 0.87, 0.71, 0.91 and 0.63 times the median yet has had years on the road to attract reports. Meanwhile 2009, 2011 and 2013 through 2015 hover close to the median, at 1.02, 1.13, 1, 1.18 and 1.1 times. None of that is alarming. It reads as ordinary volume for this model.
Why recalls belong in the picture
A recall is a defect the manufacturer has acknowledged and must repair at no charge to the owner. A complaint is one owner's unverified account. Because the two measure different things, a year with many recalls and few complaints usually points to problems caught and repaired under warranty.
The table shows it. The 2016 and 2019 cars each list 6 recalls, the most of any year, yet they land under the median on complaints at 102 and 74. The 2022 year lists none.
The no-charge promise has a limit. Under 49 U.S.C. §30120(g), a manufacturer need not repair a vehicle at no cost when it was first bought more than 15 calendar years before the recall notice or order. For the older Mazda 3 years in this range, ask a dealer whether a given open recall still qualifies instead of assuming it does.
Where owners filed their complaints
NHTSA sorts each report into a component bucket picked when the complaint is filed. Across all 15 years, the six leading buckets for the Mazda 3 look like this.
| Component bucket | Reports, 2008 to 2022 | How to read it |
|---|---|---|
| Unknown or other | 301 | A catch-all, so it points to no particular part |
| Electrical system | 220 | Battery, wiring, lighting and control modules, not one part |
| Structure | 182 | Prominent in 2010, the peak year |
| Steering | 168 | The leading area for 2008 |
| Service brakes | 131 | Owners reporting brake defects, not routine pad wear |
| Seats | 126 | Any seat problem an owner filed, with no part singled out |
The largest bucket is the one that says the least, since it holds reports with no clear component. The named areas that give a mechanic a place to start are electrical system, structure and steering. Counts like these show where owners filed, not how many cars failed or which part gave out.
Five ways these numbers can mislead
- Sales volume: a model year that sold well collects more reports than a rare one of equal quality, which is why each year is set against the Mazda 3's own median.
- Time on the road: older years had longer to attract filings, so the youngest rows look better than they have earned.
- Unverified accounts: a complaint records what an owner believed happened. It helps in aggregate and misleads one car at a time.
- Recalls run the other way: the manufacturer admitted the defect and repairs it at no charge, so many recalls on a year can mean problems were found and handled.
- No single-car meaning: none of this describes the car you are standing next to. Its own history is a question for its VIN.
A high multiple is a prompt to look closer
Every year in the table holds cared-for cars and neglected ones. Use a high multiple as a cue to examine the car more closely and bargain harder, never as grounds to dismiss one sight unseen.
Inspecting a 2010, 2008 or 2012 Mazda 3
These are the years where a careful look pays the most, and the complaint buckets suggest where to aim it.
- Run the 17-character VIN through NHTSA's recall lookup before anything else. Campaigns attach to production ranges rather than whole model years, so only the VIN shows which apply to this car and whether the repair was done.
- Ask for maintenance records. On a compact this old, a documented service history counts for more than any model-year statistic.
- Point the inspector at the area the year is known for in the complaint data: structure for a 2010, steering for a 2008, power train for a 2012. Ask what they find rather than telling them what you expect.
- Test the electrical system on every year. Lights, windows, locks, warning lamps and dashboard displays should all behave, since it is the largest named bucket overall.
- Check what a model year cannot show: the national title record, a theft and total-loss screen on the VIN, and whether the odometer readings climb in a believable sequence.
From a model year to the actual car
With room in the budget, the 2016 through 2019 cars are a sensible first look, since their complaint volume sits under the median and they have had time to show a pattern. If price pushes you toward 2010, 2008 or 2012, that can work too. The trade is more inspection effort and a firmer demand for records, and a flagged car with documented care can beat a quiet year that arrives with no paperwork.
A model year describes a population, while a VIN describes one car. For that car's own record, this site offers a free preview of what turns up for a VIN, and a one-time paid report adds accident records with a damage map, odometer readings, title brands and liens. Hold those against what the seller says, then have a mechanic look it over.
Where this information comes from
- NHTSA: Vehicle safety — Home of the federal owner-complaint database behind the yearly counts and component buckets.
- NHTSA: Recalls — Source of the recall counts per model year, and the VIN lookup for open campaigns on one car.
- Bureau of Justice Assistance: NMVTIS — Federal overview of the national title record, which covers a single car's title history.
- NICB: VINCheck — A no-cost screen of one VIN for reported theft and total-loss status.
Sources and photos: Facts checked against the sources above in October 2026. Photo by Crosby Hinze on Unsplash; diagrams by YourVINHistory.
Keep reading
- 2010 Mazda 3 recalls and complaints: what NHTSA's file saysThe peak year's own record page, with its recall campaigns and complaints by component.
- Mazda recallsHow to find open Mazda recalls by VIN, the first check on any 3.
- Pre-purchase inspectionWhat a mechanic's inspection covers and how to line one up before you pay.
- Chevrolet Cruze years to avoid, ranked by NHTSA complaintsAnother compact ranked against its own median, for a like-for-like comparison.
Frequently asked questions
Which Mazda 3 years should I avoid?
The 2010 model year is the one to approach most carefully, at 686 NHTSA complaints against a yearly median of 117. The 2008 and 2012 years follow, with 303 and 226. Each of the three can still be a sound buy at the right price with service records and a clean VIN check, so treat the count as a prompt to inspect rather than a ban.
Which Mazda 3 years have the fewest complaints?
The 2022, 2020 and 2021 cars have the lightest records, at 24, 32 and 49 complaints. Those are the youngest model years, so some of the gap reflects less time for owners to file. For a longer track record with below-median volume, look at 2016 through 2019, where the multiples run from 0.63 to 0.91.
Which problem do Mazda 3 owners report most?
By NHTSA component bucket, unknown or other leads with 301 reports, followed by electrical system at 220 and structure at 182. Steering has 168, service brakes 131 and seats 126. Because the top bucket is a catch-all and the others are broad, the list shows where owners filed rather than which part failed, so a mechanic should start with electrical, structure and steering.
Is a 2010 Mazda 3 worth buying?
It can be, with conditions. The 686 complaints are a clear flag, yet 2011 drops to 132, so the trouble does not appear to run across the whole generation of years. Look for documented care, run the VIN for open recalls, ask a mechanic to examine the structure-related areas, and let any lingering doubt come off the price.
How do I check one specific Mazda 3?
Use the VIN. A model year describes a population, while open recalls, title brands, odometer readings and past damage belong to a single car. NHTSA's recall lookup shows open campaigns, NICB's VINCheck screens for theft and total-loss records, and NMVTIS holds the national title record. A mechanic's inspection then covers what no record shows.
Now check the car itself
The guide explains what to look for. The report shows what this VIN has on record.